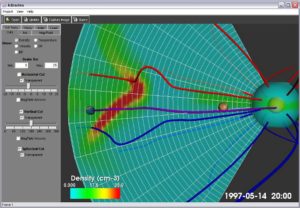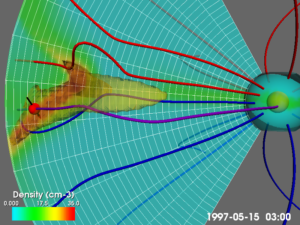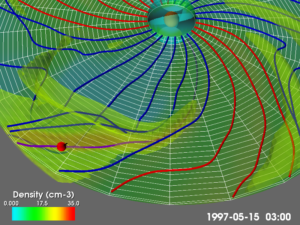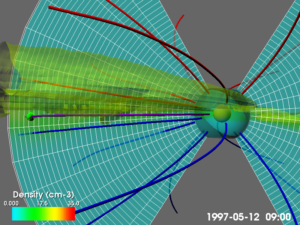


Chris built a Java program that used a visualization library that created these images from a dataset. There were multiple timesteps in the datasets, so the images could be combined into animations. The datasets were from a simulation of a coronal mass ejection from the su used to predict space weather. It was built in Java so it could be used on Windows and Linux.
The first image is a screenshot of the program with the controls. The others are images that it creates.
The program had a graphical interface where the user could change what is being shown. That data was in 3D so the options included horizontal and vertical slices (angle and up and down), magnetic field lines and a conditions at Earth. Multiple variables could be shown.
Also other planets could be shown in their actual positions based on the simulation time. If data was not being used to color them, they would have a real image of the planet. They were not to scale, since it would be hard to see them. The positions were determined by a Java library Chris built for another project.
